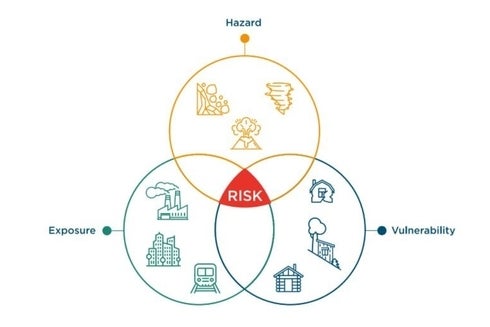
This step is designed primarily to determine exposure to natural hazards and provides only a preliminary classification of disaster and climate change risk.
This first step in the Methodology uses a top-down approach. That is, coarse-scale data and maps are used to take a first and quick glance at the contextual conditions of the larger vicinity of the operation.
Read the Step 1 section of the Methodology
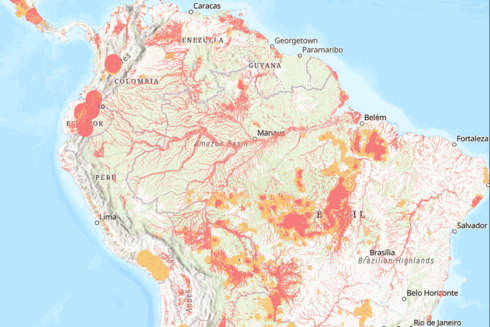
A GIS-based mapping platform containing numerous natural hazards was developed to help specialists understand the context of disaster risk that the project may face.
The GIS layers were created using global data and models with a fairly coarse resolution. Therefore, they should be considered an initial screening aid to better understand those locations that may be more exposed to hazards and not as exclusively indicative of project-specific risk.
Access the Natural Hazard Viewer for LAC countries here:
* The use of this application is for informative purposes. The IDB disclaims responsibility for the use of the data.
To complement the information provided by the IDB Natural Hazard Viewer, explore this curated catalog of data sources to support a more comprehensive analysis. It includes references to authoritative regional and global datasets from organizations such as UNDRR, the World Bank, JRC, NOAA, and ECLAC, along with country-specific sources for the 26 IDB borrowing member countries. The database provides access points—such as geoportals, downloadable geospatial datasets, and geospatial web services—where information can be found. Click below to explore maps and datasets that can enrich your analysis with trusted information.


The objective of this step is to better understand the project’s characteristics and determine its vulnerability to natural hazards and the criticality of interrupting or cancelling the services or, more broadly, the benefits provided by the project in response to damages that might result from these hazards.
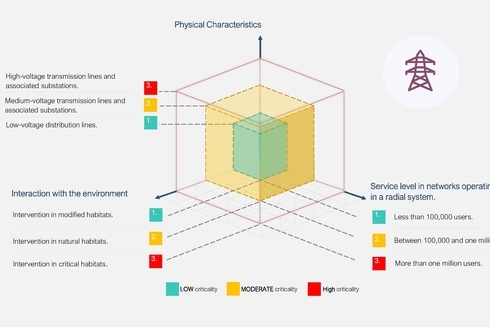
Criticality refers to the degree of significance that a structure or system holds within a larger context due to the type and scale of services or functionality it provides.
Vulnerability refers to the inherent qualities that determine a structure’s (or system’s) susceptibility to suffer damage. It encapsulates the proneness of a project in the face of a hazard.

Easy to use tables were developed for selected sectors to illustrate the concept of criticality and vulnerability and answer questions about the project scope, such as its physical characteristics, the potential interaction with population and environment, and the potential impacts in case of loss or interruption of service.
