
Small and Medium Enterprises (SMEs) can substantially contributeto a country’s long-term export growth and diversification.And trade promotion organizationscan play an important role in the process.We have foundthisafter analyzing the export performance of developing countries by using transaction-level data of all Peruvian exports between 1994 and 2019, a quarter of a century.
Think ofshortfilmsand movies.Exportsuperstarsare the leading actors in developing countries’ export“shortfilms.”Theyaccount for asignificant fraction oftheir total foreign salesin the short to medium run.According toexistingstudies, the five largest firmswerefound to beresponsible forabout one-third ofaggregateexports,almost half of export growth,and a third of growth due to diversificationoverfiveyears periods.1
And then there are“full movies”andthesupportingroles.In developing countries, lessis knownabout thecontributionof different kinds of firms in export“full movies.”Thus, themovie’splot---andthis blog---involvesfinding outthe origin and dynamics of long-runexport growth, to what extentinitially small firms contribute to this growth, and whether and howtrade policy helps them becomesuperstars.2
Short Films:SuperstarFirms Stand Out inShort to Medium RunExports
InPeru,the top five firms accountedfor an average of31% of total exportsand contributed30% to the average five-year1994-2019 exportgrowth.The importance of these large firms---and their coexistence with many small peers--- can be easily visualized whencomparingthe cumulativeshare ofexportingfirmswiththecumulativeshare of exports these firms account for. In this case, 80% of the smaller firmsgenerate less than 10% of Peru’s total exports, both in 1994 and 2019,and regardless of whether all firms or only manufacturing (and intermediaries --- retailers and wholesalers---) are considered(see Figure 1).
Figure 1
Peru, Distribution of Exports and Exporting Firms, 1994 and 2019
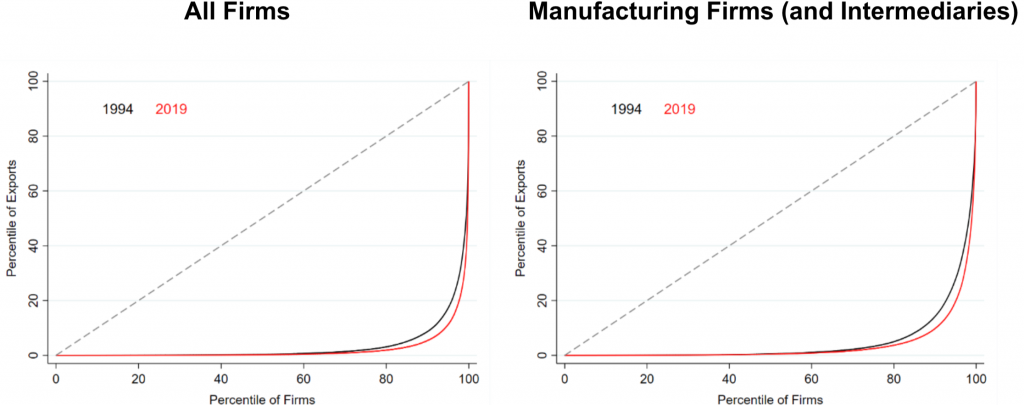 Source: Authors’ calculations based on data from SUNAT and PROMPERU.
Rewinding:Older Export Short Films
To uncover individual stories behind large firms, instead of justfocusing onthe very narrow anddistinctgroupconsisting ofthetop 5 largest firms,we consideredthe top 5% exporters(i.e., roughly 300 firms). This set of firms accounted for an average of 87%ofPeru’s total exportsover the period 1994-2019 and, as such, provides a broader picture of the diverse dynamics behind high performers in international markets.
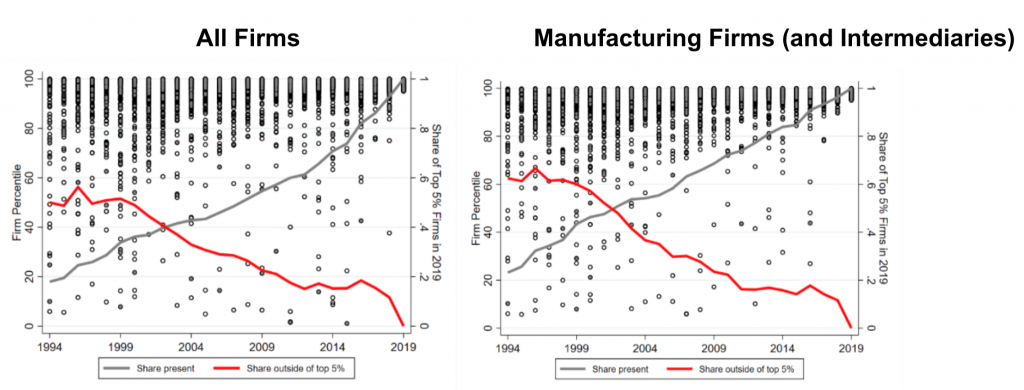
Where were the top 5% exporting firms in the previous 25 annual rankings? When we trace backward these firms, different stories emerge. In 1994,only20% of them were already exporting and spanned the entirefirm sizedistribution. Out of those, almost half were outside of the top 5%(60% in the case of manufacturers and intermediaries). The same applies to both domestic firm and multinational firms ---with the latter being15% of the top 5% exporters in 2019--- (see Figure 2).Significantly, 43% of these top exporting firms were Small and Medium-sized Enterprises (SMEs)bothin the same year and over the period 2000-2010.3
Figure 2
Peru, Top 5% Exporting Firms in 2019, 1994-2019
 Source: Authors’ calculations based on data from SUNAT and PROMPERU.
Note:Each markercorrespondstoa top 5% firm in 2019.Gray-filled markers identify multinational firms.
The Full Movie:SMEsPlayan Important Role in the Long Run Export Growth and Diversification
How muchdifferent kinds of firmscontributeto aggregate export growthdepends on the perspective:backward or forward. The existing literature has typically followed the former. In this case,we found that Peru’stop 5% exporters in 2019contributed around 90%to the export growth between 1994-2019.
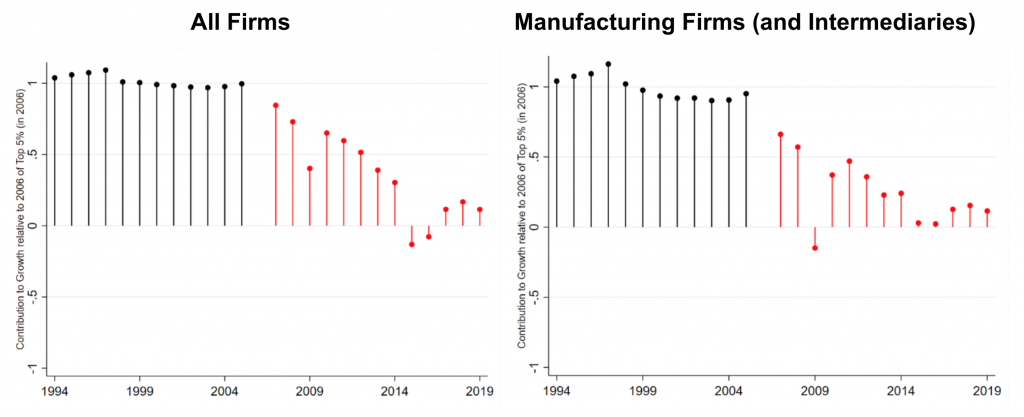
However, this amounts to start watchingthemovie from its happy end and recreate the story backward basedthereon:the sample of top firms is a selection of firms thatdid exceptionally well. As such, theyare likely to havecontributedsubstantiallytothe overall exportgrowth.This canclearlybe seen when an intermediate year such as 2006 is used as a reference. The backward contribution of top firms in 2006 to export growth is almost 100%, whereas their forward contribution steadily declines to about 20% in 2006-2019 growth (see Figure 3).
Figure 3
Peru, Backward and Forward Contribution to Aggregate Export Growth of Top 5% Firms, 1994-2019
 Source: Authors’ calculations based on data from SUNAT and PROMPERU.
Here,we proposethe reverse approach:to watch the movie as it should be --- from the beginning.Todoso,wecomputedthe share of thefutureexportgrowthexplainedby the different types of firms. More precisely, the 1994-2019 export growth is decomposed by initial exporter size and SME classification. When so doing, non-exporters that becamethetop 5% exporters in 2019 account for most of the export growth. Noteworthy, a significantportion of these firms were SMEs.Overall, SMEs contributed about 30% to growth over the last quarter-century (see Figure 4).
Figure 4
Peru, Contribution to Forward Export Growth, by Firm Size, 1994-2019
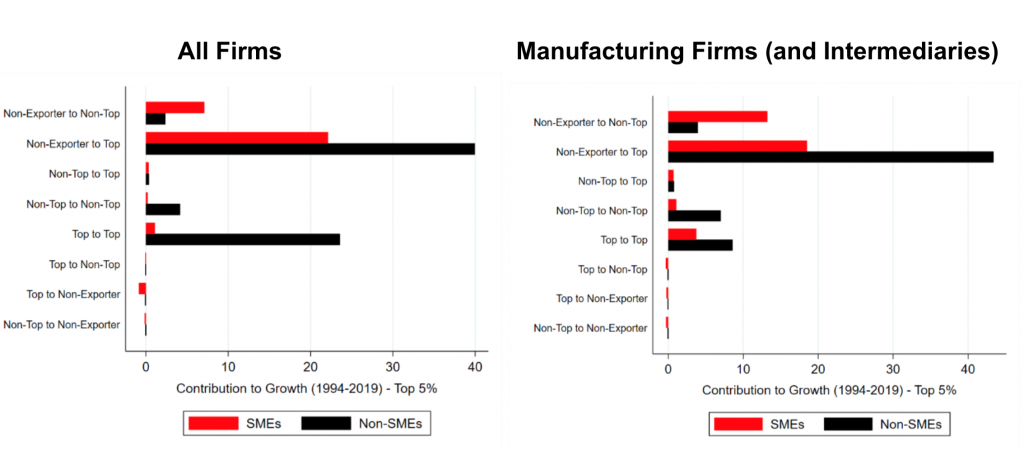 Source: Authors’ calculations based on data from SUNAT and PROMPERU.
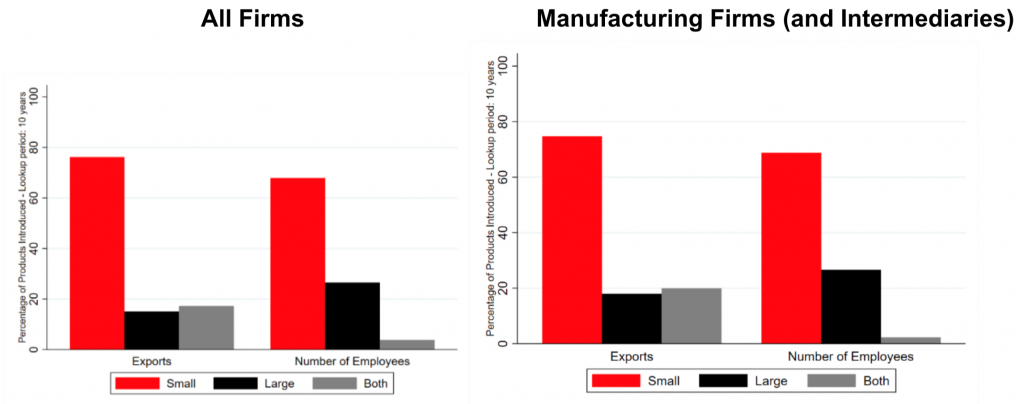
Butthat is not all.Smallerexporters,particularlySMEs, introduce a higher number of new products to the country’s export basket than their large counterparts, thereby making a decisive contribution to aggregate diversification.4Thus, SMEs were responsible for approximately 70% of all new products sold abroad by Peru during the period 2005-2019(see Figure 5).5
Figure 5
Peru, Export Product Diversification, by Firm Size, 1994-2019
 Source: Authors’ calculations based on data from SUNAT and PROMPERU.
Having an Agent Makes a Difference: Trade Promotion Organizations Can Help
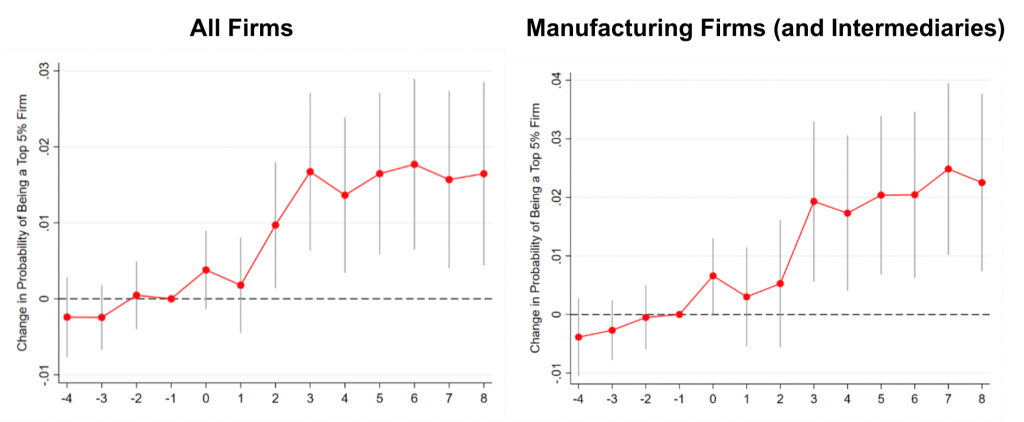
Despite the progress of information and communication technologies, firms venturing abroad for the first time, in general, and those that attempt to expand overseas, in particular, must confront severe information barriers.Trade Promotion Organizations (TPOs) providefirmswith a series of services thataim ataddressingthese information problems.The existing empirical evidence suggests thatthese serviceseffectively helpfirms enter and diversify in foreign markets. The Peruvian experience additionally reveals that trade promotion could also effectively support firmsin rising the export ladder: firms assisted by the national TPOs were significantly more likely to become top 5% exporters after being assisted than their non-assisted counterparts (see Figure 6).
Figure 6
Peru, Trade Promotion and Top Exporter, 2001-2019
 Source: Authors’ calculations based on data from SUNAT and PROMPERU.
IDBSupportsCountries and their Firms in theirInternationalization
This note has presented clear evidence that SMEs can make a substantial contribution to a country’s export growth and diversification and that trade promotion can help these firms play such a role in the process. Through its Integration and Trade Sector, the IDB provides countries in the region and their TPOs with technical and operational support to design and implement policies that assist firms in their internationalization. This support takes multiple forms, including loans, technical cooperation, studies, exchange fora (policy and business dialogues), and, noteworthy, a dedicated online business platform ---ConnectAmericas---.
1 See Freund and Pierola (2015, 2020).
2 Data come from Peruvian custom agencies. Firms exporting less than U$S 1000 are removed from the dataset (as in Fernandes et al., 2016) but all findings presented herein remain the same when these firms are included.
3 In Peru, firms with less than 200 employees are classified as SMEs (see Volpe Martincus and Carballo, 2008).
4 It is well-established in the literature that large firms export more products to more destinations. However, the fact that they have more diversified export bundles does not imply that they increase the pool of products a country’s exports.
5 New products are defined as those that have not been exported in the previous ten years. Patterns are similar when the time window is reduced to five years.