
A mappingofmappings: gathering data tohighlight solutions across the region
 TheMap ofLACInnovatorsCOVID-19allows you to explore an interactive map of anopen, unitedandconsolidateddatabase of the diverse effortsofstartupsaroundthe region. From this map, you can filter by country, category, or data source - or you can also download the information into an Excel table.Youcan find applications for education and remote work, solutions to take care of mental health and support new social challenges, platforms that facilitate local consumption towards small businesses, telemedicine, digital solutions for the managementandmonitoringofquarantine, support for diagnostic logistics, matchingsystems between supply and demand of hospital products,makerstudios offering 3D printing of materials, and much more.We put together various sources of information, such as the results ofour own crowdsourcingexercise (theform is still open), solutions curated from themapping ofConnectAmericascompanies’goodsand services, and the most relevant responses identified by the main actors in the ecosystem. All solutions go through a basic filter, which consists of verifying that: 1) the company exists2) is offering an innovative or technology-based product or service3) with implementation in our region4) can be useful to face the crisis of COVID-19 and 5) has information accessible online.
Interfaces to facilitate exploring the data
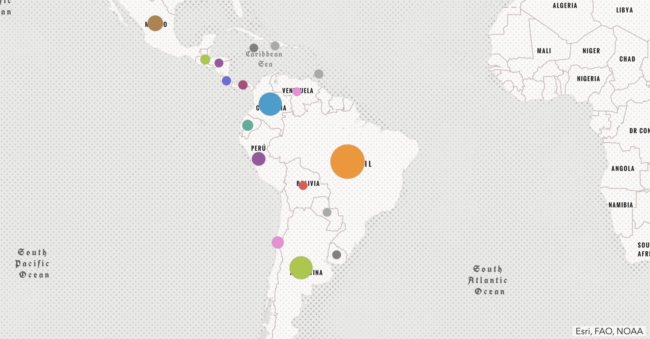
The main page of the map presents some simple options to consume the data at a first glance. In the center, there is thegeolocalizedvisualization of all the solutions available in the database. The map usesArcgis onlineto hover the data and publish a geographic map quickly and easily. The menu on the left side allows you to filter the map,and,above, there is the button that invites you to contribute more solutions to the database.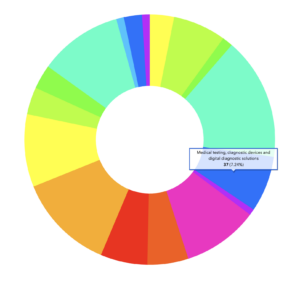 There is also a summary of the total number of solutions in the database (to date, more than 500) and the various sectors they represent.
Web Table on GitHub Pages
To expand opportunities to work with this data, we wanted to provide an open source solution so that users can download map data without opening an account atArcgisonlineor needing to understand geographic data. We found a clever option by using GitHub pages (gh-pages) to provide that data: visit the data tablehere.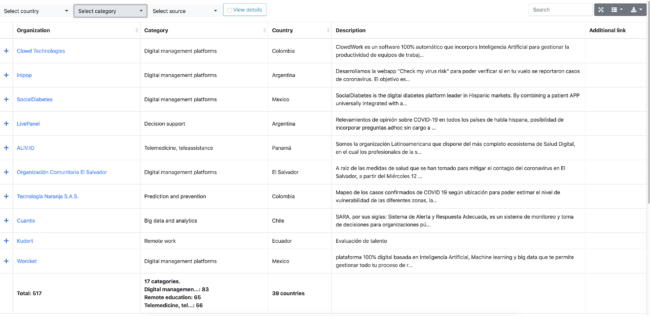 Basically, the data is transformed from a CSV format into a web table. The interface capabilities are basic: visualization, ordering, data filtering, free searches and buttons to download the content as CSV or in Excel.To create it, we did a “HelloWorld” style exercise in aGithubrepository, using aJavascript open sourcelibraries that directly connect to the data fromArcgis onlineto present the result on a Github.io page. As we post changes to the map onArcgis online, theGithubpage automatically reflectsthem. Practically, we useGithubas an open data access interface, even if that data is not hosted there.We invite you to get inspiration from this code if you have a similar case to solve. In theGithubrepository, you will find the source code under an open source license, as well as the directly published and hosted property, which tabulates all the information on the map.
What's next for the initiative?
IDBLaband its partners are working on refining the data to identify the most relevant ecosystem solutions, make them visible to our public and private sector partners, add this repository to world-class maps, make knowledge resources visible for startups and connect them with calls and other opportunities.If you have a startup or innovative solution in response to COVID-19, add ithere! If your organization has mapped relevant ventures in your community and you want to join the map as a partner, write to us at[email protected]If your company offersgoodsor services that you want to connect to the demand, sign up on theConnectAmericasmap- the IDB platform dedicated to promoting foreign trade and international investment.To find out about these and other opportunities,subscribeto the IDB Lab newsletter.Por Cristina Nolasco y JulienCollaerdel equipo BIDLab